Desenvolvimento - Visual Basic .NET
ASP.NET - Gráficos Barra e Pizza (System.Drawing)
Agora no .NET dispomos de um conjunto de classes System.Drawing que nos possibilita construir todo tipo de apresentação gráfica que for desejado.
por Ramon Durães
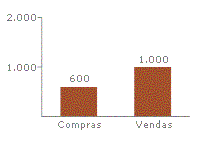
Figura 01 - Gráfico Barras
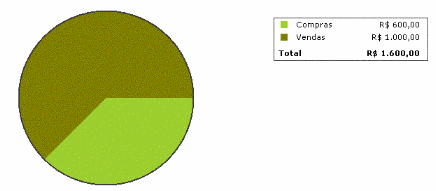
Figura 02 - Gráfico Pizza
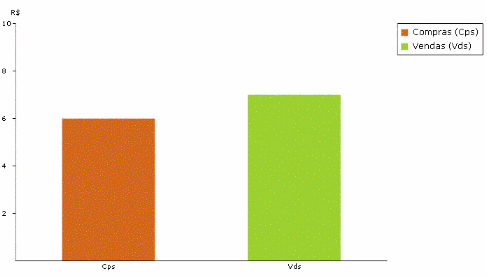
Figura 03 - Gráfico Barras
Iniciando o Projeto
Inicie um novo projeto web e chame de aspnetgraficos, depois crie uma pasta chamada de Class conforme Figura 4, será nessa pasta que vamos adicionar nossas classes.
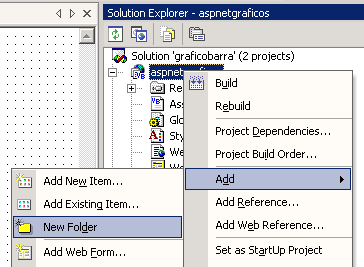
Figura 04 - Adicionando nova pasta ao projeto
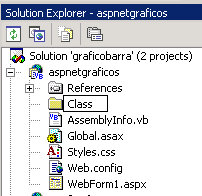
Figura 05 - Definindo nome para pasta
Conforme falei no inicio, esse projeto vai se basear em classes já prontas oferecidas no pacote do StartKit. Para adicionar a primeira classe clique com botão direito na pasta Class escolha ADD>New item, escolha um item do tipo Class e dê o nome de Chart.VB conforme Figura 06, repita os passos adicionando novos arquivos e dando os seguintes nomes (PieChart.vb,BarGraph.vb,ChartItem.vb).
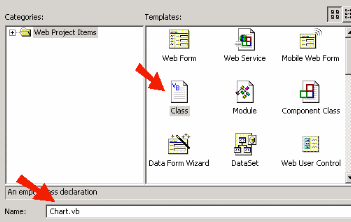
Figura 06 - Adicionando arquivo de Classe
Concluída essa etapa você já deve ter os seguintes 04(Quatro) arquivos na pasta Class conforme Figura 07.
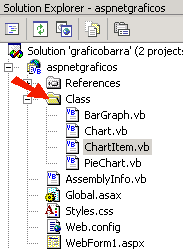
Figura 07 - 04 (Quatro) arquivos adicionados.Agora copie o código apresentado nas Listagens de 1 a 4 para respectivo arquivo de classe substituindo todo código existente no mesmo.
Listagem 1 - Código para Classe Chart.vb
Imports System
Imports System.Drawing
Imports System.Collections

Namespace ASPNET.StarterKit.Chart

"*********************************************************************
" http://www.asp.net
" StartKIT
" Chart Class
"
" Base class implementation for BarChart and PieChart
"
"*********************************************************************

Public MustInherit Class Chart

Private _colorLimit As Integer = 12

Private _color As Color() = {Color.Chocolate, Color.YellowGreen, Color.Olive, Color.DarkKhaki,
Color.Sienna, Color.PaleGoldenrod, Color.Peru, Color.Tan, Color.Khaki, Color.DarkGoldenrod,
Color.Maroon, Color.OliveDrab}

" Represent collection of all data points for the chart

Private _dataPoints As New ChartItemsCollection()

" The implementation of this method is provided by derived classes

Public MustOverride Function Draw() As Bitmap

Public Property DataPoints() As ChartItemsCollection

Get

Return _dataPoints

End Get

Set(ByVal Value As ChartItemsCollection)

_dataPoints = Value

End Set

End Property

Public Sub SetColor(ByVal index As Integer, ByVal NewColor As Color)

If index < _colorLimit Then

_color(index) = NewColor

Else

Throw New Exception("Color Limit is " + _colorLimit)

End If

End Sub "SetColor

Public Function GetColor(ByVal index As Integer) As Color

If index < _colorLimit Then

Return _color(index)

Else

Throw New Exception("Color Limit is " + _colorLimit)

End If

End Function "GetColor

End Class "Chart

End Namespace "ASPNET.StarterKit.Chart
|
Listagem 2 - Código para Classe Chartitem.vb
Imports System Imports System.Collections Imports System.Diagnostics Imports System.Drawing Namespace ASPNET.StarterKit.Chart "********************************************************************* " " ChartItem Class " " This class represents a data point in a chart " "********************************************************************* Public Class ChartItem Private _label As String Private _description As String Private _value As Single Private _color As Color Private _startPos As Single Private _sweepSize As Single Private Sub New() End Sub "New Public Sub New(ByVal label As String, ByVal desc As String, ByVal data As Single, ByVal start As Single, ByVal sweep As Single, ByVal clr As Color) _label = label _description = desc _value = data _startPos = start _sweepSize = sweep _color = clr End Sub "New Public Property Label() As String Get Return _label End Get Set(ByVal Value As String) _label = Value End Set End Property Public Property Description() As String Get Return _description End Get Set(ByVal Value As String) _description = Value End Set End Property Public Property Value() As Single Get Return _value End Get Set(ByVal Value As Single) _value = Value End Set End Property Public Property ItemColor() As Color Get Return _color End Get Set(ByVal Value As Color) _color = Value End Set End Property Public Property StartPos() As Single Get Return _startPos End Get Set(ByVal Value As Single) _startPos = Value End Set End Property Public Property SweepSize() As Single Get Return _sweepSize End Get Set(ByVal Value As Single) _sweepSize = Value End Set End Property End Class "ChartItem "********************************************************************* " " Custom Collection for ChartItems " "********************************************************************* Public Class ChartItemsCollection Inherits CollectionBase Default Public Property Item(ByVal index As Integer) As ChartItem Get Return CType(List(index), ChartItem) End Get Set(ByVal Value As ChartItem) List(index) = Value End Set End Property Public Function Add(ByVal value As ChartItem) As Integer Return List.Add(value) End Function "Add Public Function IndexOf(ByVal value As ChartItem) As Integer Return List.IndexOf(value) End Function "IndexOf Public Function Contains(ByVal value As ChartItem) As Boolean Return List.Contains(value) End Function "Contains Public Sub Remove(ByVal value As ChartItem) List.Remove(value) End Sub "Remove End Class "ChartItemsCollection End Namespace "ASPNET.StarterKit.Chart |
Imports System
Imports System.Drawing
Imports System.Collections
Imports System.Drawing.Imaging
Imports System.Drawing.Drawing2D


Namespace ASPNET.StarterKit.Chart

"*********************************************************************
"
" BarGraph Class
"
" This class uses GDI+ to render Bar Chart.
"
"*********************************************************************

Public Class BarGraph

Inherits Chart

Private _graphLegendSpacer As Single = 15.0F

Private _labelFontSize As Integer = 7

Private _legendFontSize As Integer = 9

Private _legendRectangleSize As Single = 10.0F

Private _spacer As Single = 5.0F

" Overall related members

Private _backColor As Color

Private _fontFamily As String

Private _longestTickValue As String = String.Empty " Used to calculate max value width

Private _maxTickValueWidth As Single " Used to calculate left offset of bar graph

Private _totalHeight As Single

Private _totalWidth As Single

" Graph related members

Private _barWidth As Single

Private _bottomBuffer As Single " Space from bottom to x axis

Private _displayBarData As Boolean

Private _fontColor As Color

Private _graphHeight As Single

Private _graphWidth As Single

Private _maxValue As Single = 0.0F " = final tick value * tick count

Private _scaleFactor As Single " = _maxValue / _graphHeight

Private _spaceBtwBars As Single " For now same as _barWidth

Private _topBuffer As Single " Space from top to the top of y axis

Private _xOrigin As Single " x position where graph starts drawing

Private _yOrigin As Single " y position where graph starts drawing

Private _yLabel As String

Private _yTickCount As Integer

Private _yTickValue As Single " Value for each tick = _maxValue/_yTickCount

" Legend related members

Private _displayLegend As Boolean

Private _legendWidth As Single

Private _longestLabel As String = String.Empty " Used to calculate legend width

Private _maxLabelWidth As Single = 0.0F

Public Property FontFamily() As String

Get

Return _fontFamily

End Get

Set(ByVal Value As String)

_fontFamily = Value

End Set

End Property

Public WriteOnly Property BackgroundColor() As Color

Set(ByVal Value As Color)

_backColor = Value

End Set

End Property

Public WriteOnly Property BottomBuffer() As Integer

Set(ByVal Value As Integer)

_bottomBuffer = Convert.ToSingle(Value)

End Set

End Property

Public WriteOnly Property FontColor() As Color

Set(ByVal Value As Color)

_fontColor = Value

End Set

End Property

Public Property Height() As Integer

Get

Return Convert.ToInt32(_totalHeight)

End Get

Set(ByVal Value As Integer)

_totalHeight = Convert.ToSingle(Value)

End Set

End Property

Public Property Width() As Integer

Get

Return Convert.ToInt32(_totalWidth)

End Get

Set(ByVal Value As Integer)

_totalWidth = Convert.ToSingle(Value)

End Set

End Property

Public Property ShowLegend() As Boolean

Get

Return _displayLegend

End Get

Set(ByVal Value As Boolean)

_displayLegend = Value

End Set

End Property

Public Property ShowData() As Boolean

Get

Return _displayBarData

End Get

Set(ByVal Value As Boolean)

_displayBarData = Value

End Set

End Property

Public WriteOnly Property TopBuffer() As Integer

Set(ByVal Value As Integer)

_topBuffer = Convert.ToSingle(Value)

End Set

End Property

Public Property VerticalLabel() As String

Get

Return _yLabel

End Get

Set(ByVal Value As String)

_yLabel = Value

End Set

End Property

Public Property VerticalTickCount() As Integer

Get

Return _yTickCount

End Get

Set(ByVal Value As Integer)

_yTickCount = Value

End Set

End Property

Public Sub New()

AssignDefaultSettings()

End Sub "New

Public Sub New(ByVal bgColor As Color)

AssignDefaultSettings()

BackgroundColor = bgColor

End Sub "New

"*********************************************************************
"
" This method collects all data points and calculate all the necessary dimensions
" to draw the bar graph. It is the method called before invoking the Draw() method.
" labels is the x values.
" values is the y values.
"
"*********************************************************************

Public Overloads Sub CollectDataPoints(ByVal labels() As String, ByVal values() As String)

If labels.Length = values.Length Then

Dim i As Integer

For i = 0 To labels.Length - 1

Dim temp As Single = Convert.ToSingle(values(i))

Dim shortLbl As String = MakeShortLabel(labels(i))

" For now put 0.0 for start position and sweep size

DataPoints.Add(New ChartItem(shortLbl, labels(i), temp, 0.0F, 0.0F, GetColor(i)))

" Find max value from data; this is only temporary _maxValue

If _maxValue < temp Then

_maxValue = temp

End If

" Find the longest description

If _displayLegend Then

Dim currentLbl As String = labels(i) + " (" + shortLbl + ")"

Dim currentWidth As Single = CalculateImgFontWidth(currentLbl, _legendFontSize, FontFamily)

If _maxLabelWidth < currentWidth Then

_longestLabel = currentLbl

_maxLabelWidth = currentWidth

End If

End If

Next i

CalculateTickAndMax()

CalculateGraphDimension()

CalculateBarWidth(DataPoints.Count, _graphWidth)

CalculateSweepValues()

Else

Throw New Exception("X data count is different from Y data count")

End If

End Sub "CollectDataPoints

"*********************************************************************
"
" Same as above; called when user doesn"t care about the x values
"
"*********************************************************************

Public Overloads Sub CollectDataPoints(ByVal values() As String)

Dim labels As String() = values

CollectDataPoints(labels, values)

End Sub "CollectDataPoints

"*********************************************************************
"
" This method returns a bar graph bitmap to the calling function. It is called after
" all dimensions and data points are calculated.
"
"*********************************************************************

Public Overrides Function Draw() As Bitmap

Dim height As Integer = Convert.ToInt32(_totalHeight)

Dim width As Integer = Convert.ToInt32(_totalWidth)

Dim bmp As New Bitmap(width, height)

Dim graph As Graphics = Nothing

Try

graph = Graphics.FromImage(bmp)

graph.CompositingQuality = CompositingQuality.HighQuality

graph.SmoothingMode = SmoothingMode.AntiAlias

" Set the background: need to draw one pixel larger than the bitmap to cover all area

graph.FillRectangle(New SolidBrush(_backColor), -1, -1, bmp.Width + 1, bmp.Height + 1)

DrawVerticalLabelArea(graph)

DrawBars(graph)

DrawXLabelArea(graph)

If _displayLegend Then

DrawLegend(graph)

End If

Finally

If Not (graph Is Nothing) Then

graph.Dispose()

End If

End Try

Return bmp

End Function "Draw

"*********************************************************************
"
" This method draws all the bars for the graph.
"
"*********************************************************************

Private Sub DrawBars(ByVal graph As Graphics)

Dim brsFont As SolidBrush = Nothing

Dim valFont As Font = Nothing

Dim sfFormat As StringFormat = Nothing

Try

brsFont = New SolidBrush(_fontColor)

valFont = New Font(_fontFamily, _labelFontSize)

sfFormat = New StringFormat()

sfFormat.Alignment = StringAlignment.Center

Dim i As Integer = 0

" Draw bars and the value above each bar

Dim item As ChartItem

For Each item In DataPoints

Dim barBrush As SolidBrush = Nothing

Try

barBrush = New SolidBrush(item.ItemColor)

Dim itemY As Single = _yOrigin + _graphHeight - item.SweepSize

" When drawing, all position is relative to (_xOrigin, _yOrigin)

graph.FillRectangle(barBrush, _xOrigin + item.StartPos, itemY, _barWidth, item.SweepSize)

" Draw data value

If _displayBarData Then

" This draws the value on center of the bar
Dim startX As Single = _xOrigin + i * (_barWidth + _spaceBtwBars)

Dim startY As Single = itemY - 2.0F - valFont.Height " Positioned on top of each bar by 2 pixels

Dim recVal As New RectangleF(startX, startY, _barWidth + _spaceBtwBars, valFont.Height)

graph.DrawString(item.Value.ToString("#,###.##"), valFont, brsFont, recVal, sfFormat)

End If

i += 1

Finally

If Not (barBrush Is Nothing) Then

barBrush.Dispose()

End If

End Try

Next item

Finally

If Not (brsFont Is Nothing) Then

brsFont.Dispose()

End If

If Not (valFont Is Nothing) Then

valFont.Dispose()

End If

If Not (sfFormat Is Nothing) Then

sfFormat.Dispose()

End If

End Try

End Sub "DrawBars

"*********************************************************************
"
" This method draws the y label, tick marks, tick values, and the y axis.
"
"*********************************************************************

Private Sub DrawVerticalLabelArea(ByVal graph As Graphics)

Dim lblFont As Font = Nothing

Dim brs As SolidBrush = Nothing

Dim lblFormat As StringFormat = Nothing

Dim pen As pen = Nothing

Dim sfVLabel As StringFormat = Nothing

Try

lblFont = New Font(_fontFamily, _labelFontSize)

brs = New SolidBrush(_fontColor)

lblFormat = New StringFormat()

pen = New pen(_fontColor)

sfVLabel = New StringFormat()

lblFormat.Alignment = StringAlignment.Near

" Draw vertical label at the top of y-axis and place it in the middle top of y-axis

Dim recVLabel As New RectangleF(0.0F, _yOrigin - 2 * _spacer - lblFont.Height, _xOrigin * 2, lblFont.Height)

sfVLabel.Alignment = StringAlignment.Center

graph.DrawString(_yLabel, lblFont, brs, recVLabel, sfVLabel)

" Draw all tick values and tick marks

Dim i As Integer

For i = 0 To _yTickCount - 1

Dim currentY As Single = _topBuffer + i * _yTickValue / _scaleFactor " Position for tick mark

Dim labelY As Single = currentY - lblFont.Height / 2 " Place label in the middle of tick

Dim lblRec As New RectangleF(_spacer, labelY, _maxTickValueWidth, lblFont.Height)

Dim currentTick As Single = _maxValue - i * _yTickValue " Calculate tick value from top to bottom

graph.DrawString(currentTick.ToString("#,###.##"), lblFont, brs, lblRec, lblFormat) " Draw tick value

graph.DrawLine(pen, _xOrigin, currentY, _xOrigin - 4.0F, currentY) " Draw tick mark

Next i

" Draw y axis

graph.DrawLine(pen, _xOrigin, _yOrigin, _xOrigin, _yOrigin + _graphHeight)

Finally

If Not (lblFont Is Nothing) Then

lblFont.Dispose()

End If

If Not (brs Is Nothing) Then

brs.Dispose()

End If

If Not (lblFormat Is Nothing) Then

lblFormat.Dispose()

End If

If Not (pen Is Nothing) Then

pen.Dispose()

End If

If Not (sfVLabel Is Nothing) Then

sfVLabel.Dispose()

End If

End Try

End Sub "DrawVerticalLabelArea

"*********************************************************************
"
" This method draws x axis and all x labels
"
"*********************************************************************

Private Sub DrawXLabelArea(ByVal graph As Graphics)

Dim lblFont As Font = Nothing

Dim brs As SolidBrush = Nothing

Dim lblFormat As StringFormat = Nothing

Dim pen As pen = Nothing

Try

lblFont = New Font(_fontFamily, _labelFontSize)

brs = New SolidBrush(_fontColor)

lblFormat = New StringFormat()

pen = New pen(_fontColor)

lblFormat.Alignment = StringAlignment.Center

" Draw x axis

graph.DrawLine(pen, _xOrigin, _yOrigin + _graphHeight, _xOrigin + _graphWidth, _yOrigin + _graphHeight)

Dim currentX As Single

Dim currentY As Single = _yOrigin + _graphHeight + 2.0F " All x labels are drawn 2 pixels below x-axis

Dim labelWidth As Single = _barWidth + _spaceBtwBars " Fits exactly below the bar

Dim i As Integer = 0

" Draw x labels

Dim item As ChartItem

For Each item In DataPoints

currentX = _xOrigin + i * labelWidth

Dim recLbl As New RectangleF(currentX, currentY, labelWidth, lblFont.Height)

Dim lblString As String = IIf(_displayLegend, item.Label, item.Description)

graph.DrawString(lblString, lblFont, brs, recLbl, lblFormat)

i += 1

Next item

Finally

If Not (lblFont Is Nothing) Then

lblFont.Dispose()

End If

If Not (brs Is Nothing) Then

brs.Dispose()

End If

If Not (lblFormat Is Nothing) Then

lblFormat.Dispose()

End If

If Not (pen Is Nothing) Then

pen.Dispose()

End If

End Try

End Sub "DrawXLabelArea

"*********************************************************************
"
" This method determines where to place the legend box.
" It draws the legend border, legend description, and legend color code.
"
"*********************************************************************

Private Sub DrawLegend(ByVal graph As Graphics)

Dim lblFont As Font = Nothing

Dim brs As SolidBrush = Nothing

Dim lblFormat As StringFormat = Nothing

Dim pen As pen = Nothing

Try

lblFont = New Font(_fontFamily, _legendFontSize)

brs = New SolidBrush(_fontColor)

lblFormat = New StringFormat()

pen = New pen(_fontColor)

lblFormat.Alignment = StringAlignment.Near

" Calculate Legend drawing start point

Dim startX As Single = _xOrigin + _graphWidth + _graphLegendSpacer

Dim startY As Single = _yOrigin

Dim xColorCode As Single = startX + _spacer

Dim xLegendText As Single = xColorCode + _legendRectangleSize + _spacer

Dim legendHeight As Single = 0.0F

Dim i As Integer

For i = 0 To DataPoints.Count - 1

Dim point As ChartItem = DataPoints(i)

Dim [text] As String = point.Description + " (" + point.Label + ")"

Dim currentY As Single = startY + _spacer + i * (lblFont.Height + _spacer)

legendHeight += lblFont.Height + _spacer

" Draw legend description

graph.DrawString([text], lblFont, brs, xLegendText, currentY, lblFormat)

" Draw color code

graph.FillRectangle(New SolidBrush(DataPoints(i).ItemColor), xColorCode, currentY + 3.0F,
_legendRectangleSize, _legendRectangleSize)

Next i

" Draw legend border

graph.DrawRectangle(pen, startX, startY, _legendWidth, legendHeight + _spacer)

Finally

If Not (lblFont Is Nothing) Then

lblFont.Dispose()

End If

If Not (brs Is Nothing) Then

brs.Dispose()

End If

If Not (lblFormat Is Nothing) Then

lblFormat.Dispose()

End If

If Not (pen Is Nothing) Then

pen.Dispose()

End If

End Try

End Sub "DrawLegend

"*********************************************************************
"
" This method calculates all measurement aspects of the bar graph from the given data points
"
"*********************************************************************

Private Sub CalculateGraphDimension()

FindLongestTickValue()

" Need to add another character for spacing; this is not used for drawing, just for calculation

_longestTickValue += "0"

_maxTickValueWidth = CalculateImgFontWidth(_longestTickValue, _labelFontSize, FontFamily)

Dim leftOffset As Single = _spacer + _maxTickValueWidth

Dim rtOffset As Single = 0.0F

If _displayLegend Then

_legendWidth = _spacer + _legendRectangleSize + _spacer + _maxLabelWidth + _spacer

rtOffset = _graphLegendSpacer + _legendWidth + _spacer

Else

rtOffset = _spacer " Make graph in the middle

End If

_graphHeight = _totalHeight - _topBuffer - _bottomBuffer " Buffer spaces are used to print labels

_graphWidth = _totalWidth - leftOffset - rtOffset

_xOrigin = leftOffset

_yOrigin = _topBuffer

" Once the correct _maxValue is determined, then calculate _scaleFactor

_scaleFactor = _maxValue / _graphHeight

End Sub "CalculateGraphDimension

"*********************************************************************
"
" This method determines the longest tick value from the given data points.
" The result is needed to calculate the correct graph dimension.
"
"*********************************************************************

Private Sub FindLongestTickValue()

Dim currentTick As Single

Dim tickString As String

Dim i As Integer

For i = 0 To _yTickCount - 1

currentTick = _maxValue - i * _yTickValue

tickString = currentTick.ToString("#,###.##")

If _longestTickValue.Length < tickString.Length Then

_longestTickValue = tickString

End If

Next i

End Sub "FindLongestTickValue

"*********************************************************************
"
" This method calculates the image width in pixel for a given text
"
"*********************************************************************

Private Function CalculateImgFontWidth(ByVal [text] As String, ByVal size As Integer, ByVal family As
String) As Single

Dim bmp As Bitmap = Nothing

Dim graph As Graphics = Nothing

Dim font As font = Nothing

Try

font = New font(family, size)

" Calculate the size of the string.

bmp = New Bitmap(1, 1, PixelFormat.Format32bppArgb)

graph = Graphics.FromImage(bmp)

Dim oSize As SizeF = graph.MeasureString([text], font)

Return oSize.Width

Finally

If Not (graph Is Nothing) Then

graph.Dispose()

End If

If Not (bmp Is Nothing) Then

bmp.Dispose()

End If

If Not (font Is Nothing) Then

font.Dispose()

End If

End Try

End Function "CalculateImgFontWidth

"*********************************************************************
"
" This method creates abbreviation from long description; used for making legend
"
"*********************************************************************

Private Function MakeShortLabel(ByVal [text] As String) As String

Dim label As String = [text]

If [text].Length> 2 Then

Dim midPostition As Integer = Convert.ToInt32(Math.Floor(([text].Length / 2)))

label = [text].Substring(0, 1) + [text].Substring(midPostition, 1) + [text].Substring([text].Length - 1, 1)

End If

Return label

End Function "MakeShortLabel

"*********************************************************************
"
" This method calculates the max value and each tick mark value for the bar graph.
"
"*********************************************************************

Private Sub CalculateTickAndMax()

Dim tempMax As Single = 0.0F

" Give graph some head room first about 10% of current max

_maxValue *= 1.1F

If _maxValue <> 0.0F Then

" Find a rounded value nearest to the current max value

" Calculate this max first to give enough space to draw value on each bar

Dim exp As Double = Convert.ToDouble(Math.Floor(Math.Log10(_maxValue)))

tempMax = Convert.ToSingle((Math.Ceiling((_maxValue / Math.Pow(10, exp))) * Math.Pow(10, exp)))

Else

tempMax = 1.0F

End If

" Once max value is calculated, tick value can be determined; tick value should be a whole number

_yTickValue = tempMax / _yTickCount

Dim expTick As Double = Convert.ToDouble(Math.Floor(Math.Log10(_yTickValue)))

_yTickValue = Convert.ToSingle((Math.Ceiling((_yTickValue / Math.Pow(10, expTick))) * Math.Pow(10,
expTick)))

" Re-calculate the max value with the new tick value

_maxValue = _yTickValue * _yTickCount

End Sub "CalculateTickAndMax

"*********************************************************************
"
" This method calculates the height for each bar in the graph
"
"*********************************************************************

Private Sub CalculateSweepValues()

" Called when all values and scale factor are known

" All values calculated here are relative from (_xOrigin, _yOrigin)

Dim i As Integer = 0

Dim item As ChartItem

For Each item In DataPoints

" This implementation does not support negative value

If item.Value>= 0 Then

item.SweepSize = item.Value / _scaleFactor

End If

" (_spaceBtwBars/2) makes half white space for the first bar

item.StartPos = _spaceBtwBars / 2 + i * (_barWidth + _spaceBtwBars)

i += 1

Next item

End Sub "CalculateSweepValues

"*********************************************************************
"
" This method calculates the width for each bar in the graph
"
"*********************************************************************

Private Sub CalculateBarWidth(ByVal dataCount As Integer, ByVal barGraphWidth As Single)

" White space between each bar is the same as bar width itself

_barWidth = barGraphWidth / (dataCount * 2) " Each bar has 1 white space

_spaceBtwBars = _barWidth

End Sub "CalculateBarWidth

"*********************************************************************
"
" This method assigns default value to the bar graph properties and is only
" called from BarGraph constructors
"
"*********************************************************************

Private Sub AssignDefaultSettings()

" default values

_totalWidth = 700.0F

_totalHeight = 450.0F

_fontFamily = "Verdana"

_backColor = Color.White

_fontColor = Color.Black

_topBuffer = 30.0F

_bottomBuffer = 30.0F

_yTickCount = 2

_displayLegend = False

_displayBarData = False

End Sub "AssignDefaultSettings

End Class "BarGraph

End Namespace "ASPNET.StarterKit.Chart
|
Imports System
Imports System.Collections
Imports System.Drawing
Imports System.Drawing.Imaging
Imports System.Drawing.Drawing2D

Namespace ASPNET.StarterKit.Chart

"*********************************************************************
"
" PieChart Class
"
" This class uses GDI+ to render Pie Chart.
"
"*********************************************************************

Public Class PieChart

Inherits Chart

Private _bufferSpace As Integer = 125

Private _chartItems As ArrayList

Private _perimeter As Integer

Private _backgroundColor As Color

Private _borderColor As Color

Private _total As Single

Private _legendWidth As Integer

Private _legendHeight As Integer

Private _legendFontHeight As Integer

Private _legendFontStyle As String

Private _legendFontSize As Single

Public Sub New()

_chartItems = New ArrayList

_perimeter = 250

_backgroundColor = Color.White

_borderColor = Color.FromArgb(63, 63, 63)

_legendFontSize = 8

_legendFontStyle = "Verdana"

End Sub "New

Public Sub New(ByVal bgColor As Color)

_chartItems = New ArrayList

_perimeter = 250

_backgroundColor = bgColor

_borderColor = Color.FromArgb(63, 63, 63)

_legendFontSize = 8

_legendFontStyle = "Verdana"

End Sub "New

"*********************************************************************
"
" This method collects all data points and calculate all the necessary dimensions
" to draw the chart. It is the first method called before invoking the Draw() method.
"
"*********************************************************************

Public Sub CollectDataPoints(ByVal xValues() As String, ByVal yValues() As String)

_total = 0.0F

Dim i As Integer

For i = 0 To xValues.Length - 1

Dim ftemp As Single = Convert.ToSingle(yValues(i))

_chartItems.Add(New ChartItem(xValues(i), xValues.ToString(), ftemp, 0, 0, Color.AliceBlue))

_total += ftemp

Next i

Dim nextStartPos As Single = 0.0F

Dim counter As Integer = 0

Dim item As ChartItem

For Each item In _chartItems

item.StartPos = nextStartPos

item.SweepSize = item.Value / _total * 360

nextStartPos = item.StartPos + item.SweepSize

counter = counter + 1

item.ItemColor = GetColor(counter)

Next

CalculateLegendWidthHeight()

End Sub "CollectDataPoints

"*********************************************************************
"
" This method returns a bitmap to the calling function. This is the method
" that actually draws the pie chart and the legend with it.
"
"*********************************************************************

Public Overrides Function Draw() As Bitmap

Dim perimeter As Integer = _perimeter

Dim pieRect As New Rectangle(0, 0, perimeter, perimeter - 1)

Dim bmp As New Bitmap(perimeter + _legendWidth, perimeter)

Dim grp As Graphics = Nothing

Dim sf As StringFormat = Nothing

Try

grp = Graphics.FromImage(bmp)

sf = New StringFormat


"Paint Back ground

grp.FillRectangle(New SolidBrush(_backgroundColor), 0, 0, perimeter + _legendWidth, perimeter)

"Align text to the right

sf.Alignment = StringAlignment.Far

"Draw all wedges and legends

Dim i As Integer

For i = 0 To _chartItems.Count - 1

Dim item As ChartItem = CType(_chartItems(i), ChartItem)

Dim brs As SolidBrush = Nothing

Try

brs = New SolidBrush(item.ItemColor)

grp.FillPie(brs, pieRect, item.StartPos, item.SweepSize)

grp.FillRectangle(brs, perimeter + _bufferSpace, i * _legendFontHeight + 15, 10, 10)

grp.DrawString(item.Label, New Font(_legendFontStyle, _legendFontSize), New SolidBrush(Color.Black),
perimeter + _bufferSpace + 20, i * _legendFontHeight + 13)

grp.DrawString(item.Value.ToString("C"), New Font(_legendFontStyle, _legendFontSize), New
SolidBrush(Color.Black), perimeter + _bufferSpace + 200, i * _legendFontHeight + 13, sf)

Finally

If Not (brs Is Nothing) Then

brs.Dispose()

End If

End Try

Next i

"draws the border around Pie

grp.DrawEllipse(New Pen(_borderColor, 2), pieRect)

"draw border around legend

grp.DrawRectangle(New Pen(_borderColor, 1), perimeter + _bufferSpace - 10, 10, 220, _chartItems.Count *
_legendFontHeight + 25)

"Draw Total under legend

grp.DrawString("Total", New Font(_legendFontStyle, _legendFontSize, FontStyle.Bold), New
SolidBrush(Color.Black), perimeter + _bufferSpace + 30, (_chartItems.Count + 1) * _legendFontHeight, sf)

grp.DrawString(_total.ToString("C"), New Font(_legendFontStyle, _legendFontSize, FontStyle.Bold), New
SolidBrush(Color.Black), perimeter + _bufferSpace + 200, (_chartItems.Count + 1) * _legendFontHeight,
sf)

grp.SmoothingMode = SmoothingMode.AntiAlias

Finally

If Not (sf Is Nothing) Then

sf.Dispose()

End If

If Not (grp Is Nothing) Then

grp.Dispose()

End If

End Try

Return bmp

End Function "Draw

"*********************************************************************
"
" This method calculates the space required to draw the chart legend.
"
"*********************************************************************

Private Sub CalculateLegendWidthHeight()

Dim fontLegend As New Font(_legendFontStyle, _legendFontSize)

_legendFontHeight = fontLegend.Height + 5

_legendHeight = fontLegend.Height * (_chartItems.Count + 1)

If _legendHeight> _perimeter Then

_perimeter = _legendHeight

End If

_legendWidth = _perimeter + _bufferSpace

End Sub "CalculateLegendWidthHeight

End Class "PieChart

End Namespace "ASPNET.StarterKit.Chart
|
Listagem 5 - Código para Classe GerarGrafico.aspx.vb
Imports aspnetgraficos.ComponenteGrafico
Public Class GerarGrafico

Inherits System.Web.UI.Page

Private Sub Page_Load(ByVal sender As System.Object, ByVal e As System.EventArgs) Handles MyBase.Load

"////////////////////////////////////////
"/Recebe parametros para gerar o Grafico /
"////////////////////////////////////////

Dim xValues, yValues, Tipo_Grafico_str As String

xValues = Request.QueryString("xValues")

yValues = Request.QueryString("yValues")

Tipo_Grafico_str = Request.QueryString("Tipo_Grafico")


If Not (xValues Is Nothing) And Not (yValues Is Nothing) Then

Response.Clear()

Response.ContentType = "image/gif"

Dim bmp As Bitmap

Dim memStream As New System.IO.MemoryStream

Select Case Tipo_Grafico_str

Case "Barra"

Dim bar As New BarGraph(Color.White)

bar.VerticalLabel = "R$"

bar.VerticalTickCount = 5

bar.ShowLegend = True

bar.ShowData = False

bar.Height = 400

bar.Width = 700

bar.CollectDataPoints(xValues.Split("|".ToCharArray()), yValues.Split("|".ToCharArray()))

bmp = bar.Draw()

Case "Barra2"

Dim bar As New BarGraph(Color.White)

Dim i As Integer

For i = 0 To 6

bar.SetColor(i, Color.Sienna)

Next i

bar.VerticalTickCount = 2

bar.ShowLegend = False

bar.ShowData = True

bar.Height = 119

bar.Width = 195

bar.TopBuffer = 5

bar.BottomBuffer = 15

bar.FontColor = Color.Gray

bar.CollectDataPoints(xValues.Split("|".ToCharArray()), yValues.Split("|".ToCharArray()))

bmp = bar.Draw()

Case Else

Dim pc As New PieChart(Color.White)

pc.CollectDataPoints(xValues.Split("|".ToCharArray()), yValues.Split("|".ToCharArray()))

bmp = pc.Draw()

End Select

"Retorna o grafico para o Browser

bmp.Save(memStream, System.Drawing.Imaging.ImageFormat.Gif)

memStream.WriteTo(Response.OutputStream)

End If

End Sub

End Class
|
Agora vamos adicionar uma nova pagina que será utilizada para nossos testes, adicione o arquivo chamado de default.aspx, depois adicione um dropdownlist (ID=dpTipo,AutoPostBack=True), adicione um Image (ID=imgGrafico) conforme Figura 08. Depois adicione o código da Listagem 06.
Listagem 6 - Código para Classe default.aspx.vb
Public Class _default

Inherits System.Web.UI.Page

Private Sub Page_Load(ByVal sender As System.Object, ByVal e As System.EventArgs) Handles MyBase.Load
End Sub

Private Sub dpTipo_SelectedIndexChanged(ByVal sender As System.Object, ByVal e As System.EventArgs)
Handles dpTipo.SelectedIndexChanged

Dim valor As String = dpTipo.SelectedItem.Value

Select Case valor

Case "1"

imgGrafico.Visible = True

imgGrafico.ImageUrl = "GerarGrafico.aspx?xvalues=Compras|Vendas&yvalues=6|7&tipo_grafico=Barra"

Case "2"

imgGrafico.Visible = True

imgGrafico.ImageUrl = "GerarGrafico.aspx?xvalues=Compras|Vendas&yvalues=600|1000&tipo_grafico=Pizza"

Case "3"

imgGrafico.Visible = True

imgGrafico.ImageUrl = "GerarGrafico.aspx?xvalues=Compras|Vendas&yvalues=600|1000&tipo_grafico=Barra2"

Case "4"

imgGrafico.Visible = True

imgGrafico.ImageUrl = "GerarGrafico.aspx?tipo_grafico=Barra2&" + db()

Case "5"

imgGrafico.Visible = True

imgGrafico.ImageUrl = "GerarGrafico.aspx?tipo_grafico=Pizza&" + db()

Case Else

imgGrafico.Visible = False

End Select

End Sub

Function db() As String

"Configure aqui a senha de acesso ao banco de dados

Dim da As New System.Data.SqlClient.SqlDataAdapter("select top 10 CustomerID ID,Freight TOTAL from
Orders", "Data Source=127.0.0.1;User ID=sa;Password=;Initial Catalog=NorthWind")

Dim dt As New DataTable

da.Fill(dt)

Dim i As Int32

Dim xvalues As New System.Text.StringBuilder

Dim yvalues As New System.Text.StringBuilder

For i = 0 To dt.Rows.Count - 1

If i <> 0 Then

xvalues.Append("|")

yvalues.Append("|")

End If

xvalues.Append(dt.Rows(i)(0))

yvalues.Append(dt.Rows(i)(1))

Next

Return "xvalues=" + xvalues.ToString + "&" + "yvalues=" + yvalues.ToString

End Function

End Class
|
Agora já temos uma pagina de teste. Basta selecionar o tipo do gráfico desejado que o combo vai passar os parâmetros para a pagina gerargrafico.aspx que retorna a imagem do gráfico.
Finalizando
Adicionar gráfico hoje em uma aplicação web só vem a engrandecer o produto. O .NET oferece todas classes basicas para você realizar a implementação do gráfico que imaginar. Porém para esse caso eu recomendo a utilização de componentes prontos no mercado, que já fazem esse trabalho muito bem. Deixe para implementar no System.Drawing quando não encontrar o recurso pronto. Agora se você é um cara que se indentifica com esse tipo de implementação, essa é a hora!
Sugestões:
http://www.dotnetcharting.com
http://www.dundas.com
http://www.softwarefx.com
http://www.advsofteng.com
http://www.componentone.com
Clique aqui para baixar o código fonte.
O que você gostaria saber?
Aguardo seu comentário! Ele é muito importante. Participe!!! Até próximo artigo!
Você é de Salvador Bahia, então participe do grupo de usuários .NET http://www.mutex.com.br

Ramon Durães - Especialista em desenvolvimento de software e Microsoft Most Valuable Professional (MVP) em Visual Studio Team System. Realiza treinamentos de .NET Framework em empresas, consultoria em arquitetura de software e implantação de Visual Studio Team System. Palestrante nos principais eventos da Microsoft no Brasil (Tech-Ed 2005, Tech-Ed 2006, Tech-Ed 2007, Tech-Ed 2008, Tech-ED 2009), Microsoft Innovation Days 2007 (Salvador, Brasília, Recife, Goiânia, Natal, Maringá), Microsoft Innovation Days 2009 (Salvador) , Campus Party Brasil 2009 e eventos regionais relacionados a grupos de usuários e universidades. Conhecido autor de artigos para os principais portais de conteúdo e autor de 10 publicações eletrônicas em CD (Video-Aula) pela editora Linha de Código além dos livros "Desenvolvendo para web usando o Visual Studio 2008" e "Gerenciando projetos de software usando Visual Studio Team System" pela editora Brasport. Pode ser encontrado em seu blog http://www.ramonduraes.net e @ramonduraes no Twitter.
- Entity Framework 4: Repositório GenéricoVisual Basic .NET
- As edições 14 da Easy .net Magazine e 88 da .net Magazine já estão disponíveis.ADO.NET
- Postando no Twiiter com .NET e Migre.meC#
- Setup ApplicationsVisual Basic .NET
- Problemas na manipulação de arquivos do MS Excel com .NETVisual Basic .NET